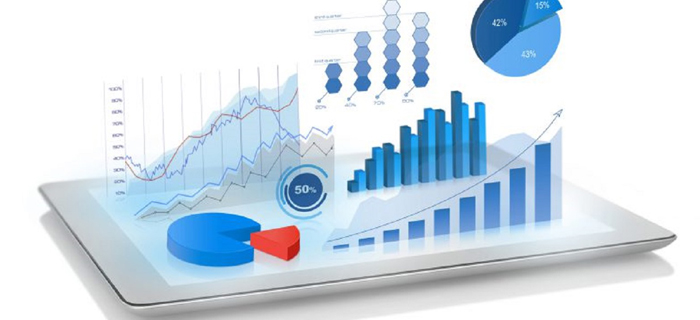


Dashboard reporting is a graphical illustration of an organization’s key presentation indicators (KPIs). Reports are created by pulling organized data from existing reports available, giving the user a graphical snapshot of a firm’s operations. Dashboard reporting gives everybody in an organization, irrespective of technological expertise, the capacity to analyze data in real time via intuitive dashboards.
Viewing any form of info using graphics makes data easier to recognize, analyze, and process into actionable insights. Adding the functionality of dashboard reporting offers a comprehensive and clear view of all business insights at a look. A dashboard can be made by linking it to Excel databases or other software that data and reporting is made on. It can be programmed so that as data is uploaded to the database or broadcasting system, the charts and graphs are automatically updated. Dashboard reporting converts critical in a vibrant business environment, providing real-time insights that can be represented upon to steer organizations toward their goals.
It is important to know the changes between dashboard reporting and a static report.
An interactive dashboard report offers users with strong data visualization that allows exploration and interactivity. The data offers insights into why procedures are currently the way they are or why certain outcomes occurred. It has the capability to drill down into rough data, if required. It can also be a real-time process; a sale managed at the point of sale is reflected in the dashboard within minutes.
Though a static report does embrace images, graphs, and charts, it is entirely based on historical data and efforts only on the past. These booms are usually generated once a day, week, or month and are circulated via email or manually accessed via a shared folder or program. While they still offer value for KPIs that need to be measured on a regular basis, static reporting is inferior to dashboard reporting in terms of ease of use, agility, and value gained.
Organizations generate huge amount of structured and unstructured data through their systems, transactions, internet interactions, customer care procedures and other business processes. This data can be extracted to generate highly targeted insights on business operations. However, most organizations are restricted by their thoughtful of data and what can be done with it.
We deliver business analytics & dashboards that incorporate data from online and offline sources and help businesses constantly monitor and track key performance indicators.